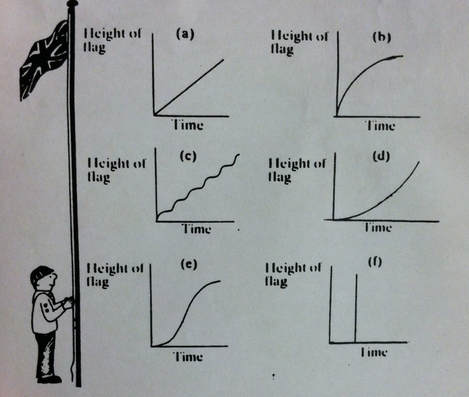
A.) In graph a it is showing that the boy is hoisting the flag up the pole at a constant speed.
B.) In graph b it is showing that the boy pulls the flag up fast in the beginning, then he begins to to slow down.
C.) In graph c it is showing that the boy is very inconsistent. He pulls it fast for a little, then begins to go slow, then fast, and the process repeats itself until he gets to the top.
D.) In graph d it is showing that the boy hoists the flag up very slowly at first, then begins to pull it up very fast towards the end.
E.) In graph e it is showing that the boy pulled the flag slow at first, then slowed down, and sped up again till the top.
F.) In graph f it is showing that the boy pulled the flag up super fast, which would be impossible for the flag to instantly be at the top as shown in graph f.
I believe that graph a would be the most realistic, because most people would pull a flag up at a constant speed.
I believe that graph f is the least realistic, because it is physically impossible for the flag to be raised to the top in zero time.
