A. Most of my prediction graphs were close to the actual graph.Either my graph increased too rapidly or slowly, I was never on the exact line.
B. The zeros on my graph represent the skateboard when it hasn't moved and the clock hasn't started.
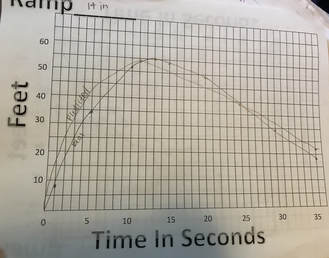
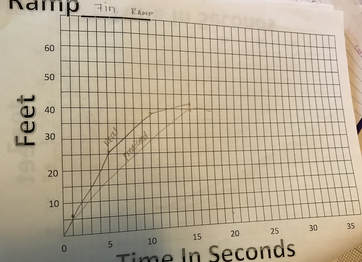
C. The shorter the ramp, the smaller the maximum for the skateboard. Also the higher the ramp the faster the skateboard increases, and goes a lot farther.
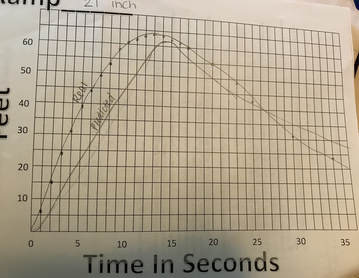
D. The graph rises the fastest on the 21 inch ramp, which means that the skateboard is going faster at this height than the others. It also falls the fastest at the same height because it has a lot more speed than the other heights.
B. The zeros on my graph represent the skateboard when it hasn't moved and the clock hasn't started.
C. The shorter the ramp, the smaller the maximum for the skateboard. Also the higher the ramp the faster the skateboard increases, and goes a lot farther.
D. The graph rises the fastest on the 21 inch ramp, which means that the skateboard is going faster at this height than the others. It also falls the fastest at the same height because it has a lot more speed than the other heights.
|
|
